Interfacing with Blynk
If you are looking for a beautiful looking app to dashboard your sensors and control things then Blynk is a really great option. Blynk supports Android and IOS and makes connecting sensors and actuators to the app really simple. Here are some examples:

We have created an interface that support the following JemRF sensor functions:
- Temperature sensor (All modules)
- DS18B20 Temperature Sensor (Flex Module)
- DHT22 Temperature and Humidity Sensor (Flex module)
- Wireless switch sensor (all modules)
- Battery levels (All modules)
- Relay A and B for remote control from the Blynk app (Flex module)
- Analog A and B sensors (Flex module)
JemRF to Blynk Temperature Gauge Tutorial
What you will need:
- Any model Raspberry Pi with preferably the full Raspbian distro (you can use Rasbian Lite but will need to install Python and PIP)
- Wireless Base Station for Raspberry Pi or Flex RF Module
- Any wireless sensor
What you need to know beforehand:
- How to operate a Raspberry Pi
- You have already set up your wireless base station and tested your sensor
- Some Python programming knowledge is preferable but not mandatory as we provide you with the source code
Step 1: Download the app
Download the Blynk app and start a new project. The app will ask you which hardware you have. Select Raspberry Pi Device and take note of the Auth Token. There is also useful option to have the token sent to you via email.
Step 2: Configure the app
Tap on the dotted canvas of the project that will bring up the widget box and select Gauge. A gauge frame will now be visible on the canvas.

Click on the gauge and give your sensor a name and color.
In the input section link the gauge to your JemRF temperature Sensor ID by clicking in the PIN box and changing the scroll wheel to “Virtual” (if it’s not already Virtual) and then change the ID on the right to VXX where XX is your JemRF sensor ID.
Set the two values to the Min and Max of the gauge. I chose "0" and "30".
In the Label section change the value to /pin/C or /pin/F – depending on whether your sensor values are in Celsius to Fahrenheit.
Refresh interval is “PUSH”

Click OK and the press the play triangle on the top right. It will say “New Project is Offline”.
Step 3: Connect your Raspberry Pi to Blynk
Open up your Raspberry PI terminal and download the Blynk JemRF interface.
Install the Blynk libraries as follows:
sudo apt-get update && sudo apt-get upgrade
sudo apt-get install python-pip
sudo pip install blynklib
Now download the JemRF interface for Blynk:
https://github.com/JemRF/rf_tools.git
cd rf_tools
Open up rf2blynk.py:
sudo nano rf2blynk.py
Page down to where it says:
BLYNK_AUTH = 'YourTokenHere'
Replace YourTokenHere with the token you emailed yourself earlier.
Exit and Save by pressing “ctrl-x” then “y”, then “ENTER KEY”.
Now run the application by typing:
python rf2blynk.py
You should see something like this:

Step 4: Check your app is online and updating
Now open up the app and you should now see the project is online as shown below:

Wait for a temperature reading to be processed and then you should see the temperature gauge update:

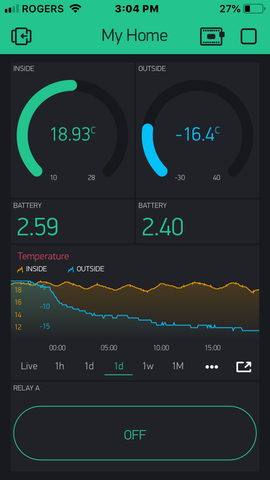
Add a SuperChart
Now that you have your project online and updating you can start to easily add other widgets. The SuperChart is a good option if you plan to display temperature and humidity. You can add multiple sensors to the same chart which saves space on the dashboard.
Tap the dotted canvas as before and select the SuperChart. The chart has may configurations you can play with. I will focus on the important ones. Use DATASTREAMS to link lines on the graph with sensors. Add a data stream, give it a name and and click on the settings icon alongside it.

In the INPUT section configure a Virtual Input with the device ID of the JemRF temperature sensor we configured in the previous section. Give it a suffix of C or F and make the decimals configuration #.# for one decimal place.

You can configure how the chart aggregates your data. I found the high resolution of 1d useful to give me a detailed chart of the past 24 hours. The chart has a full screen option that provides a view of the chart in landscape mode using the full screen of your device.
It will take some time to build up the data but initially you probably want to start with the Live feed option so you can see if the data is populating the chart and then switch to 1h and then 1d as the data history gets populated.
Here is an example of a chart with two datastreams:

Remote control JemRF modules from Blynk

If you followed the above sections you should now be comfortable with configuring the Blynk dashboard and connecting dashboard widgets to your JemRF sensors. In this section I'll explain how to switch a relay connected to the JemRF Flex radio module, using the Blynk button widget.
In the above video you can see how the Blynk button can be used to send on/off messages to your RapberryPi, which can send messages over the air to the Flex RF module. We've hooked up a couple LED's to GPIO1 and GPIO2 pins of the Flex module to demonstrate how these pins can be turned high/low from the Blynk dashboard.
We have a separate tutorial on the Flex module that explains how to configure and wire the Flex module to a remote relay switch that you can use to switch high voltage appliances and lights.
Step 1 - Add the button widget to your Blynk dashboard
Select the "button" widget from the Blynk Widget Box and click on it to configure it. Give it a name and in the output section give it a unique virtual pin ID. Make sure this ID does not conflict with any of your JemRF modules.
Step 2 - Configure the Raspberry Pi interface
Open up rf2blynk.py on your Raspberry Pi and configure these three settings:
button1=13 ##This is the Blynk virtual ID
Note: if you change the above from 13 to something else then you also need to change the "13" in the following lines further down in rf2blynk.py:
@blynk.handle_event('write V13')
def v13_write_handler(pin, value):
button1RFRelayID=3 ##This is the JemRF module ID
button1RFRelay="A" ##"A" for RELAYA, "B" for RELAYB
They should be self explanatory. Change button1 to be equal to theID you configured for the button, ste the button1RFRelayID equal to the ID of your Flex module and lastly configure button1RFRelay to "A" or "B", depending on which relay pin you want to control.
Now run the application:
python rf2blynk.py
Click the button on the dashboard and you should see messages being printed to the screen every time you click the button.
Configure a Wireless Switch Indicator
You can easily configure the JemRF wireless switch with Blynk. Simply add an LED widget in your Bylnk project and assign the virtual p;in number to the same number as your wireless switch.
The LED will switch on when the door is closed and off when the door is open. Unfortunately you can't change that around like you can with some of the other widgets but you can adjust rf2blynk.py to swap it around by applying the changes in red below:
if data.startswith('BUTTONON') or data.startswith('STATEON'):
devID=str(int(devID)+30)
sensordata=1
PEPFunction=26
if data.startswith('BUTTONOFF') or data.startswith('STATEOFF'):
devID=str(int(devID)+30)
sensordata=255
PEPFunction=26
You might also want to use a Label widget instead of an LED by applying the following changes to the code:
if data.startswith('BUTTONON') or data.startswith('STATEON'):
devID=str(int(devID)+30)
sensordata="Door Closed"
PEPFunction=26
if data.startswith('BUTTONOFF') or data.startswith('STATEOFF'):
devID=str(int(devID)+30)
sensordata="Door Open"
PEPFunction=26
Display a battery indicator
There are two widgets that make this possible. Either use a Label widget to display the numerical battery reading, or use a Level widget using a min value of 1.9V and max of 3.3V (use 1.9 as min because JemRF wireless devices stop operating at below 2V).